
Review: Machine learning - the skill of mutual fund managers
Published:
This paper uses machine learning method to predict fund returns, and shows fund characteristics can consistently differentiate high from low-performing mutual funds, as well as identify funds with net-of-fees abnormal returns. Fund momentum and fund flow are the most important predictors of future risk-adjusted fund performance, while characteristics of the stocks that funds hold are not predictive. Returns of predictive long-short portfolios are higher following a period of high sentiment or a good state of the macro-economy. Their estimation with neural networks enables us to uncover novel and substantial interaction effects between sentiment and both fund flow and fund momentum.
Machine learning - the skill of mutual fund managers
Kaniel, Lin, Pelger, Nieuwerburgh
2. Data
2.1 Mutual funds
Mutual funds actively managed mutual funds underlined mostly with the U.S. domestic equities, from CRSP Survivor Bias-free Mutual Fund Database.
Fund holdings from Thomson Financial Mutual Fund Holdings.
Data shape 407158x3257, from Jan 1980 to Jan 2019.
2.2 Abnormal fund returns
first: factor loadings are estimated over the prior 36 months: \begin{equation} \tag{1} R_{i,t-36:t-1} = \alpha_i + F_{t-36:t-1} \hat \beta_{i,t-1} + \eta_{i,t-36:t-1} \end{equation}
second: abnormal fund returns \(\tag{2} R^{abn}_{i,t} = R_{i,t} - F_t \hat{\beta_{i,t-1}}\)
2.3 Holding based characteristic
- stock characteristcs are from
Chen, Pelger, and Zhu (2020)covering 46 firm characteristics. - cross-sectionally normalized to range from -0.5 to 0.5 based on stocks’ rankings on that characteristic.
2.4 Fund and family characteristic
- 13 fund characteristics in 3 catagories: momentum, fund characteristics, fund family characteristics
2.5 Macro-economic information
- investor sentiment
Baker and Wurgler (2006) - Chicago Fed National Activity Index (CF-NAI) is itself an index of many macro time series.
3. In-sample fund performance by univariant characteristic
findings 1: portfolios based on fund characteristics associate with highest sharp ratio, in particluar fund momentum and flow are with the highest sharp ratio.
findings 2: Most stock-specific characteristics cannot systematically differentiate between the performance of mutual funds.
strong association between abnormal performance and fund characteristics is driven by above averge sentiment periods. (interaction effect)
multivariate regression result shows factor model does not span by equity asset pricing factors.
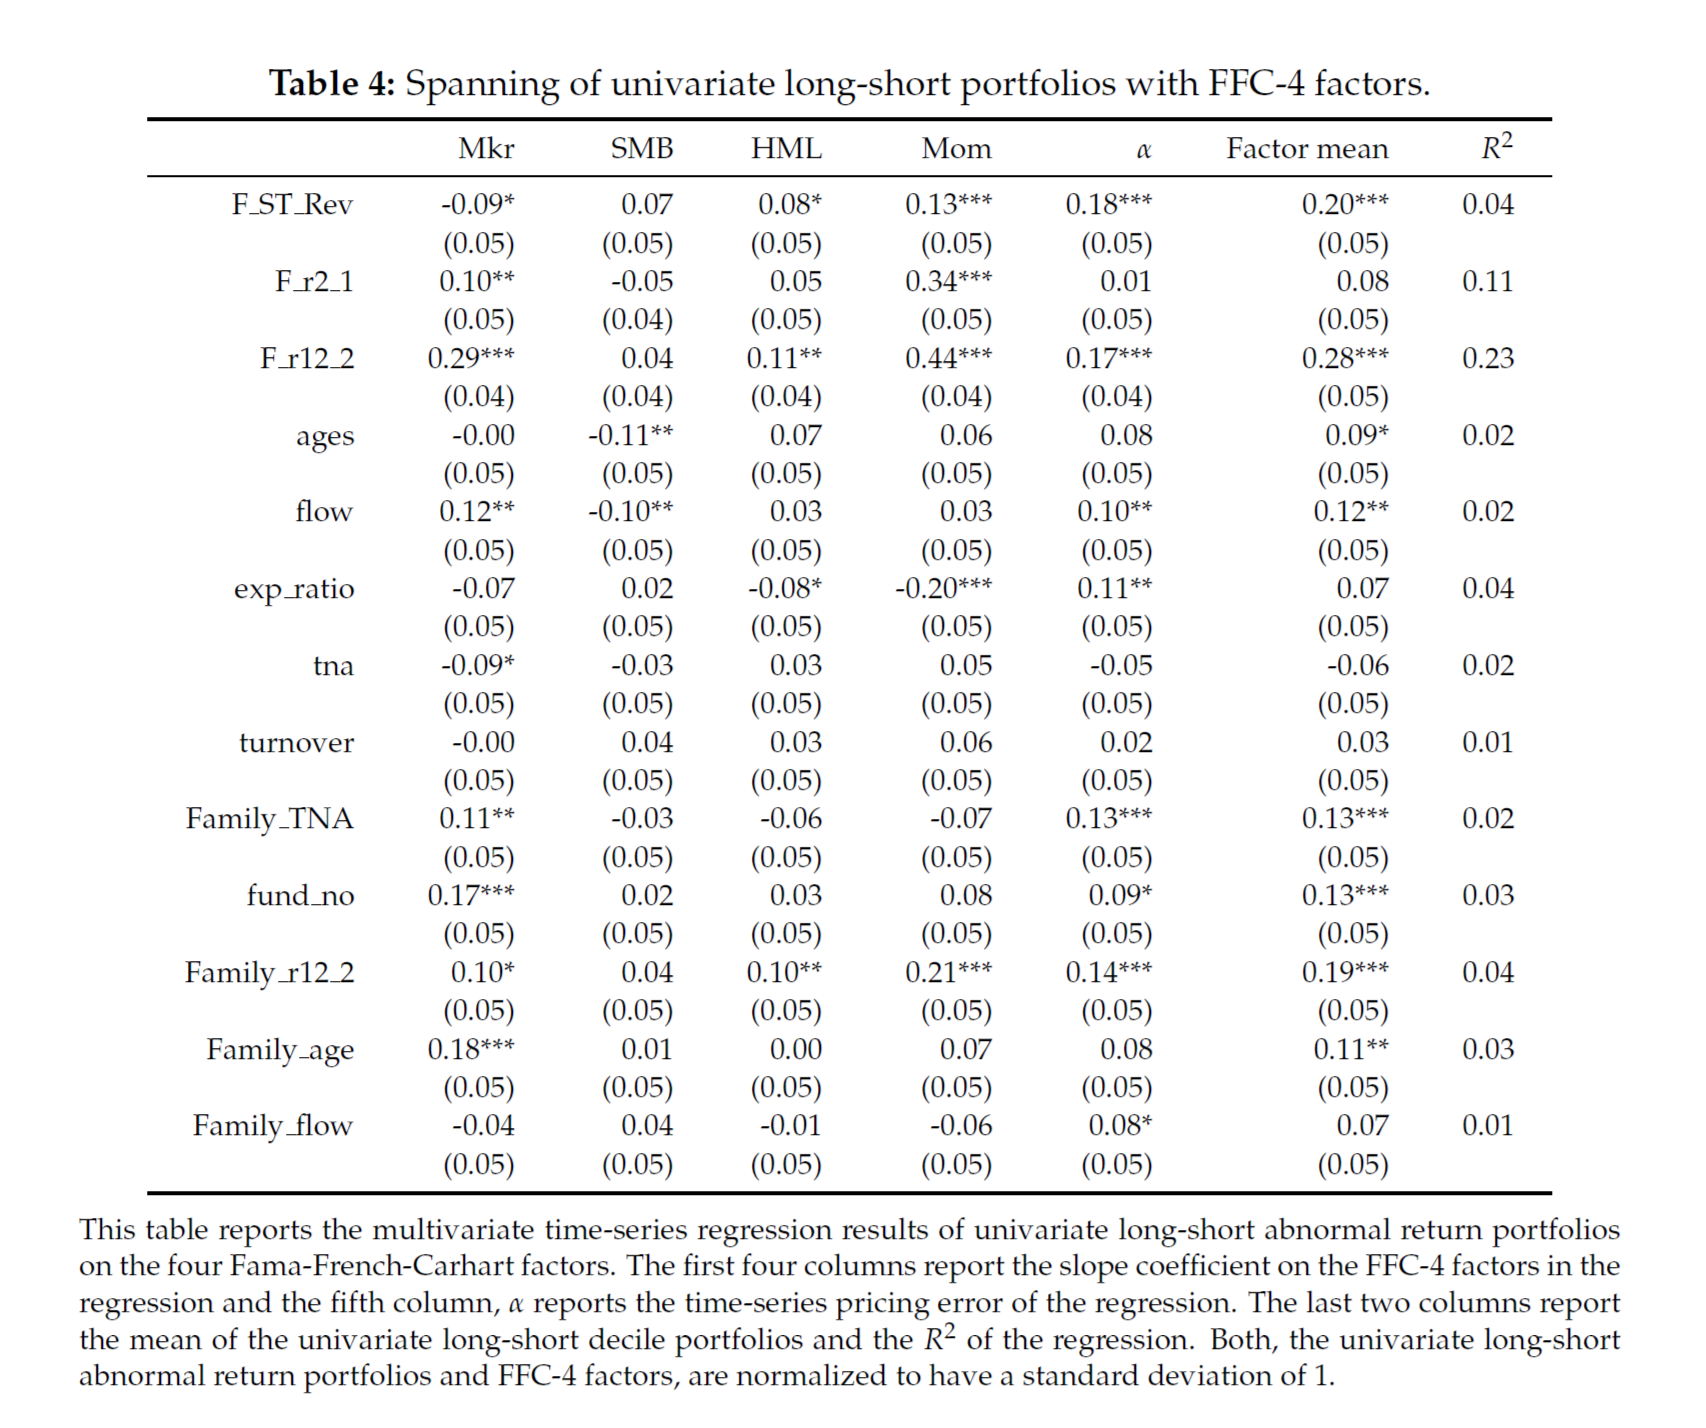
holding period does not matter, monthly rebalancing of mutual funds is not crucial to earning the high abnormal returns associated with strongly-performing funds.
4. Main analysis
- cross-out-of-sample evaluation, divide the data into 3 subsamples randomly instread of a conventional chronological data split.
- the random sampling is crucial for measuring the dependencies on macroeconomic states.
- the random sampling method helps to diminish the effect of particular subperiods.
4.1 Neural network
- feedforward network combins raws predictors linearly, and applies non-linear transformation (ReLU).
- the results are robust to the choice of tuning parameters.
4.2 Optimal prediction
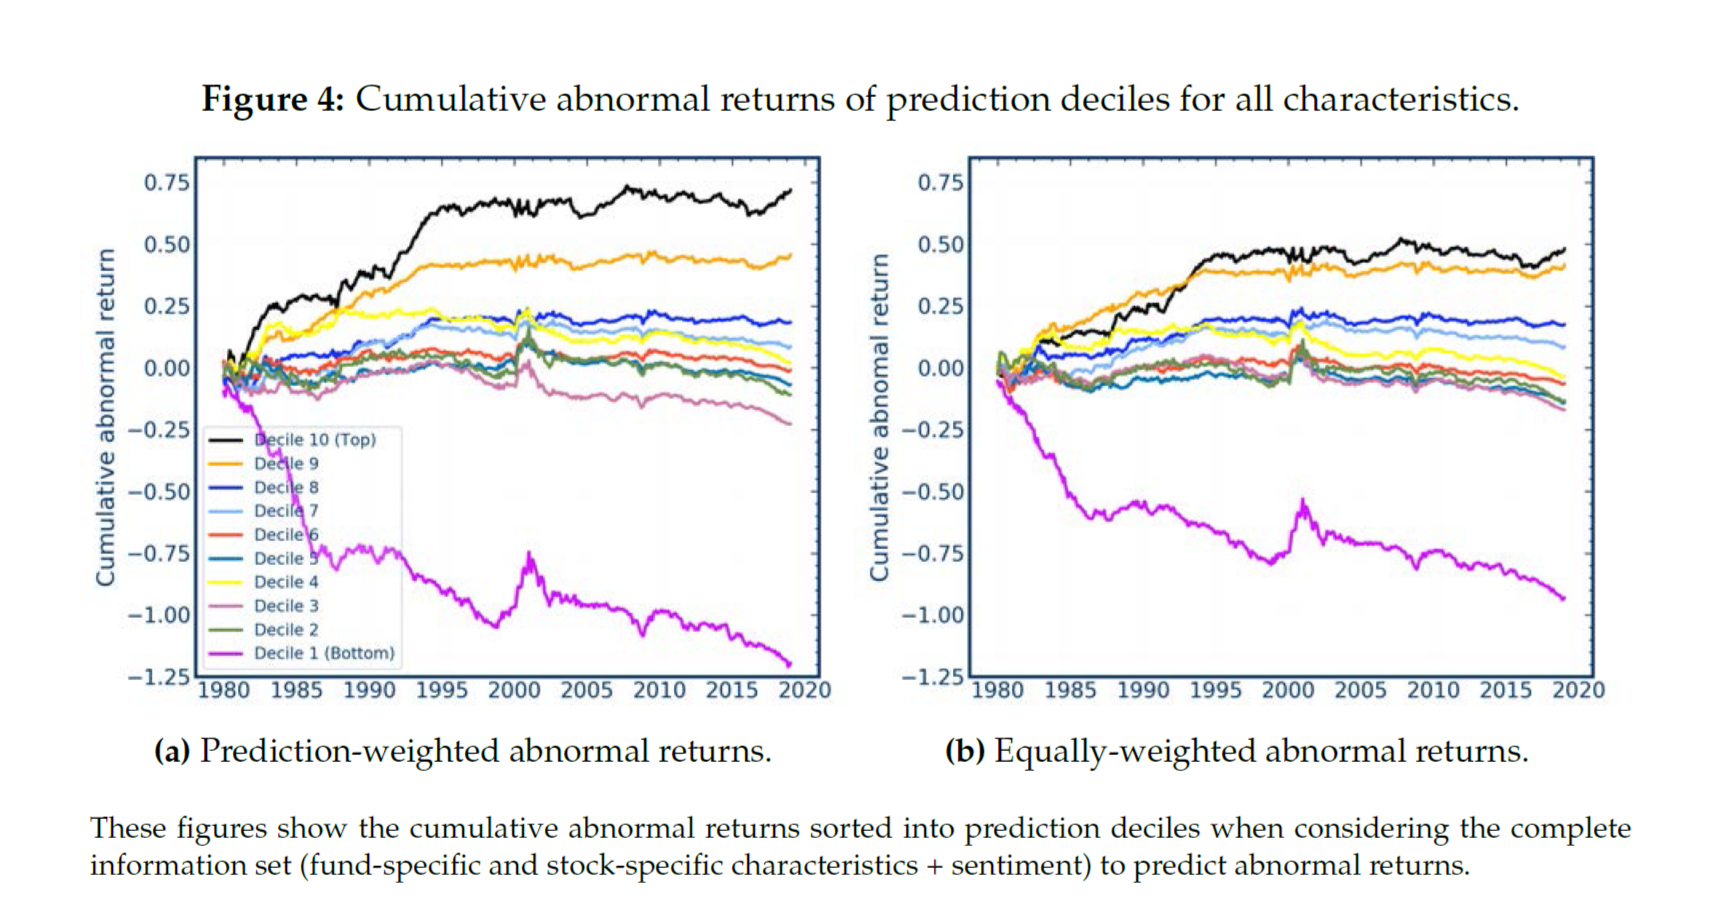
Sort the funds in deciles, within each deciles they weight the funds equally or by thier predicted value. The predcition weighted portfolio exploits the heterogeneity in the prediction and assigns a higher relative weight to predictions that deviates from the center of the deciles.
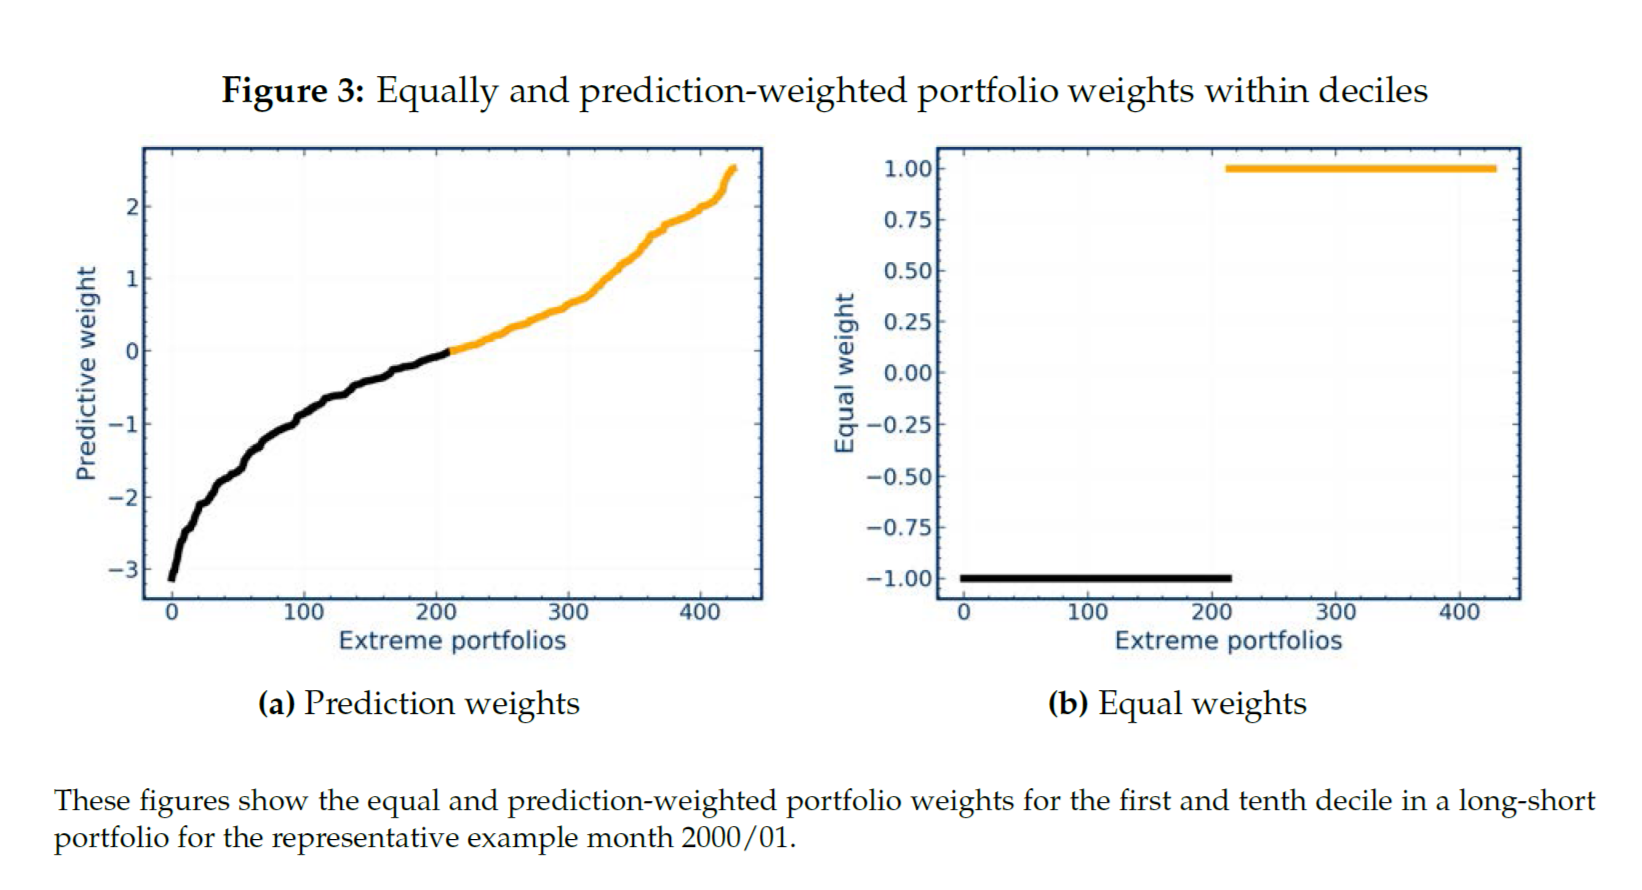
The pic on the right only uses neural network to sort funds into deciles, while the left one uses neural network prediction form the weights. From the plot we see a larger speard in the prediction weighted portfolios. Hence the prediction weighted portfolio is choosen as a baseline model.
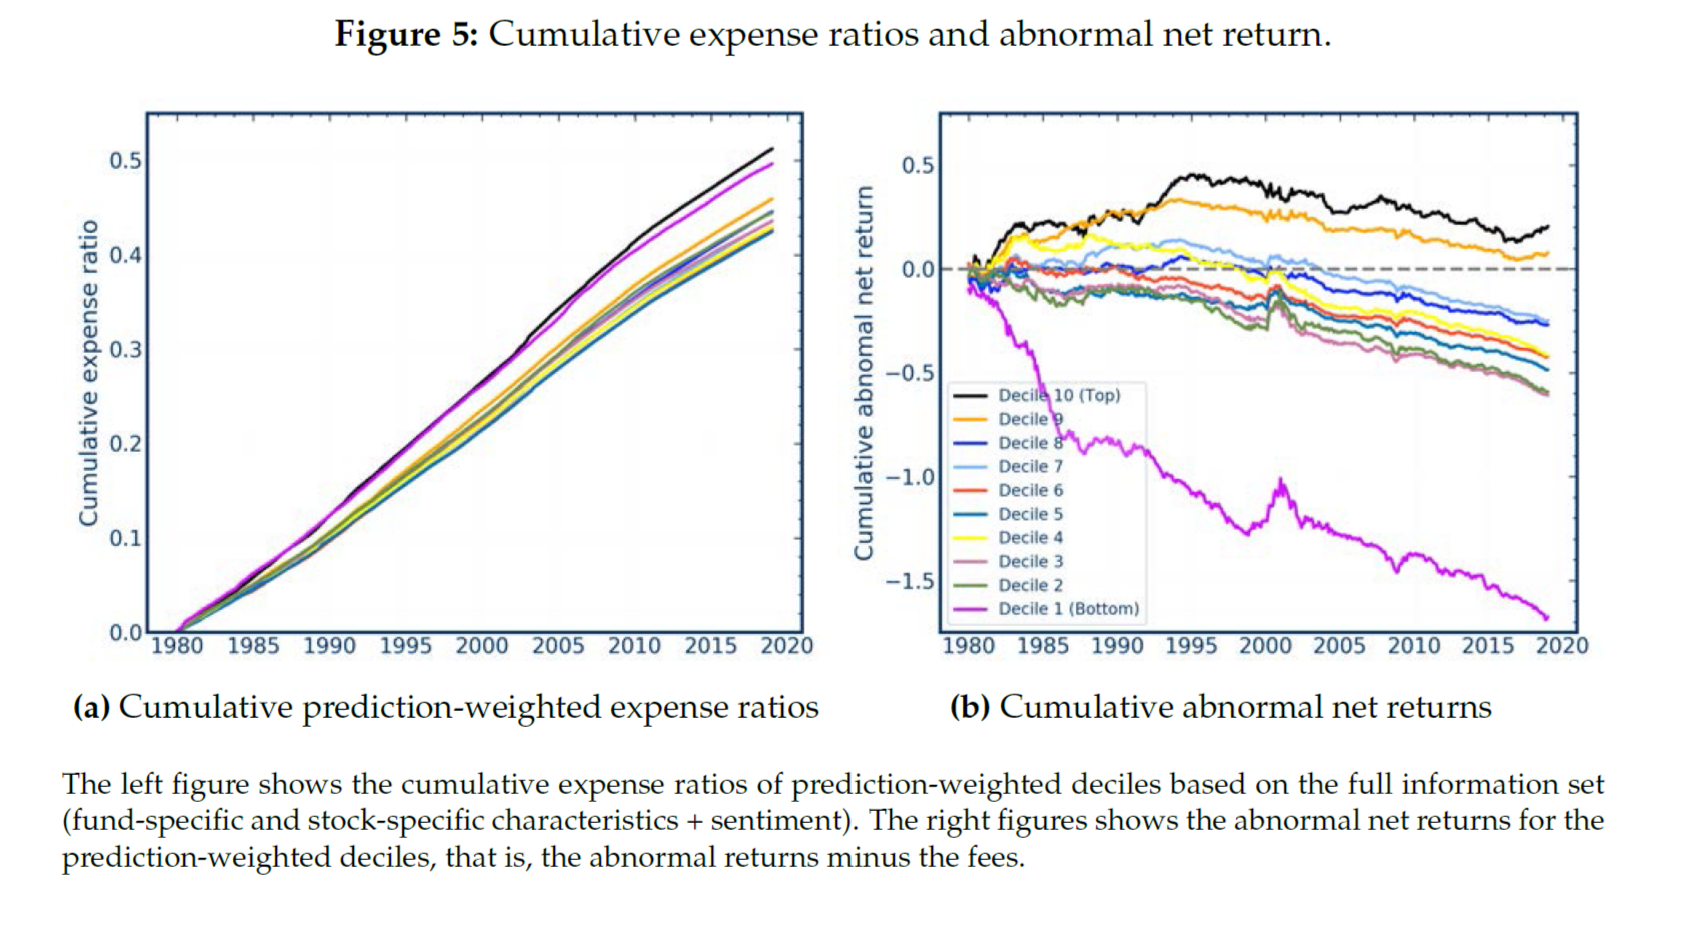
fee adjusted retrun. The pic on the left shows funds with higher predicted and abnormal returns charge a higher fee. The pic on the right shows in the top two deciles still earn a positive abnormal retrun after fee.
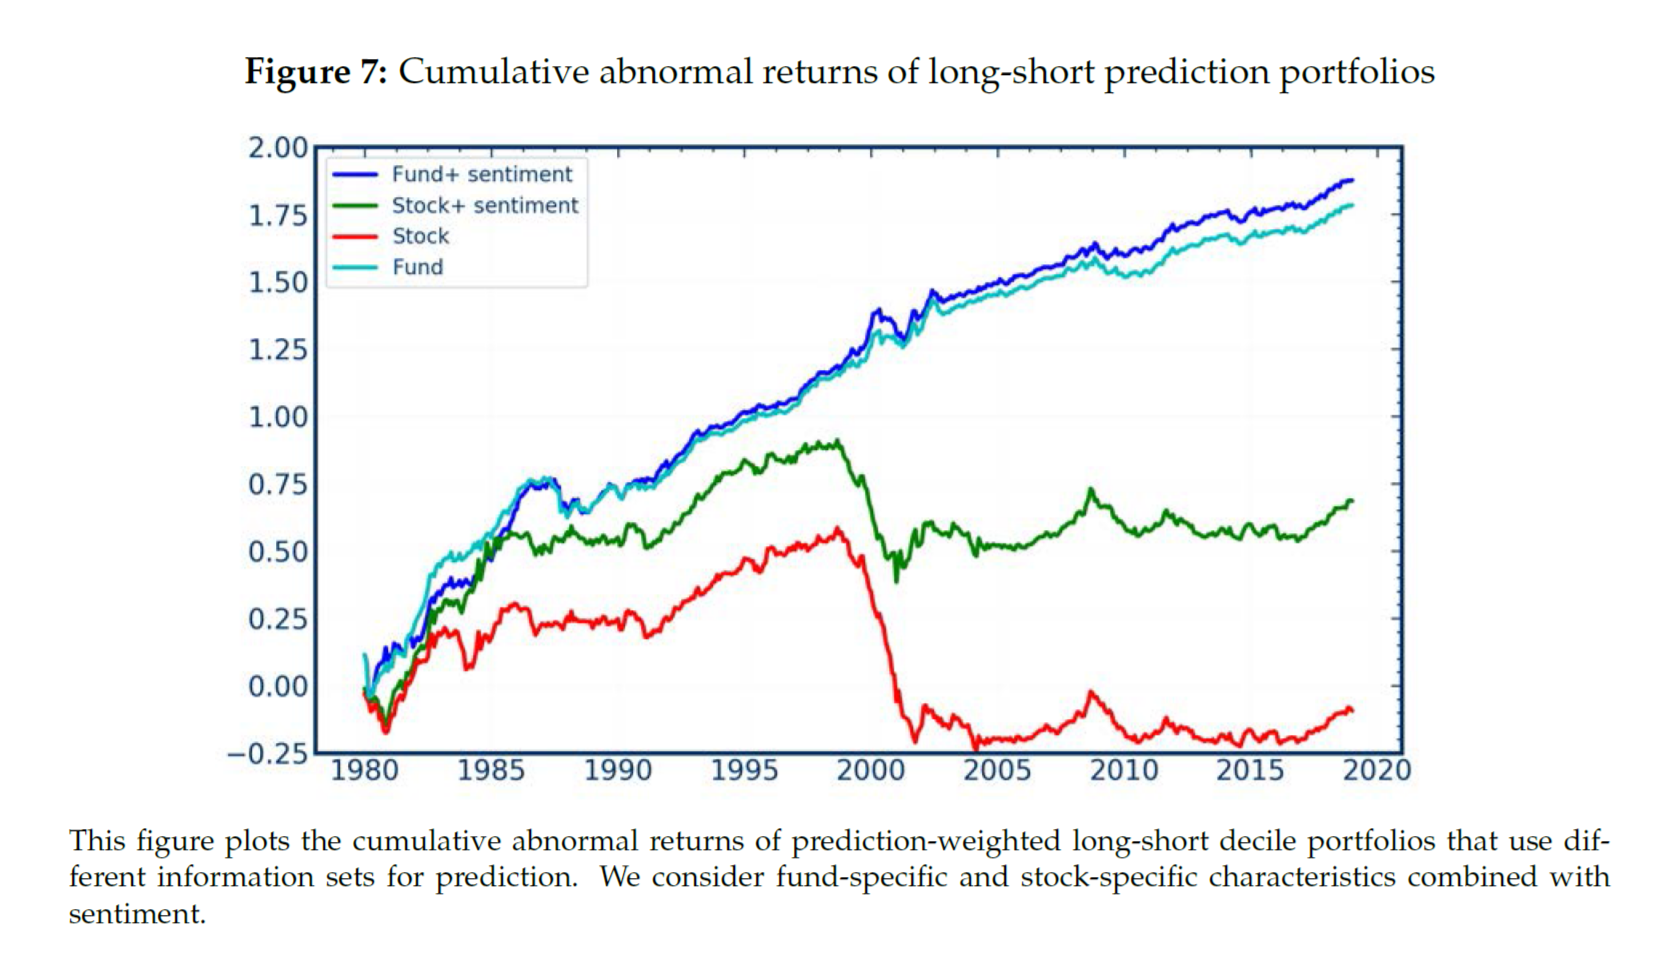
4.3 Which information most useful when predicting fund abnormal returns?
Main findings: the interaction of fund-level variables and sentiment results in the best performance. While, stock characteristcs alone or sentiment yeild fail to yeild good performances with respect to fund abnormal return.
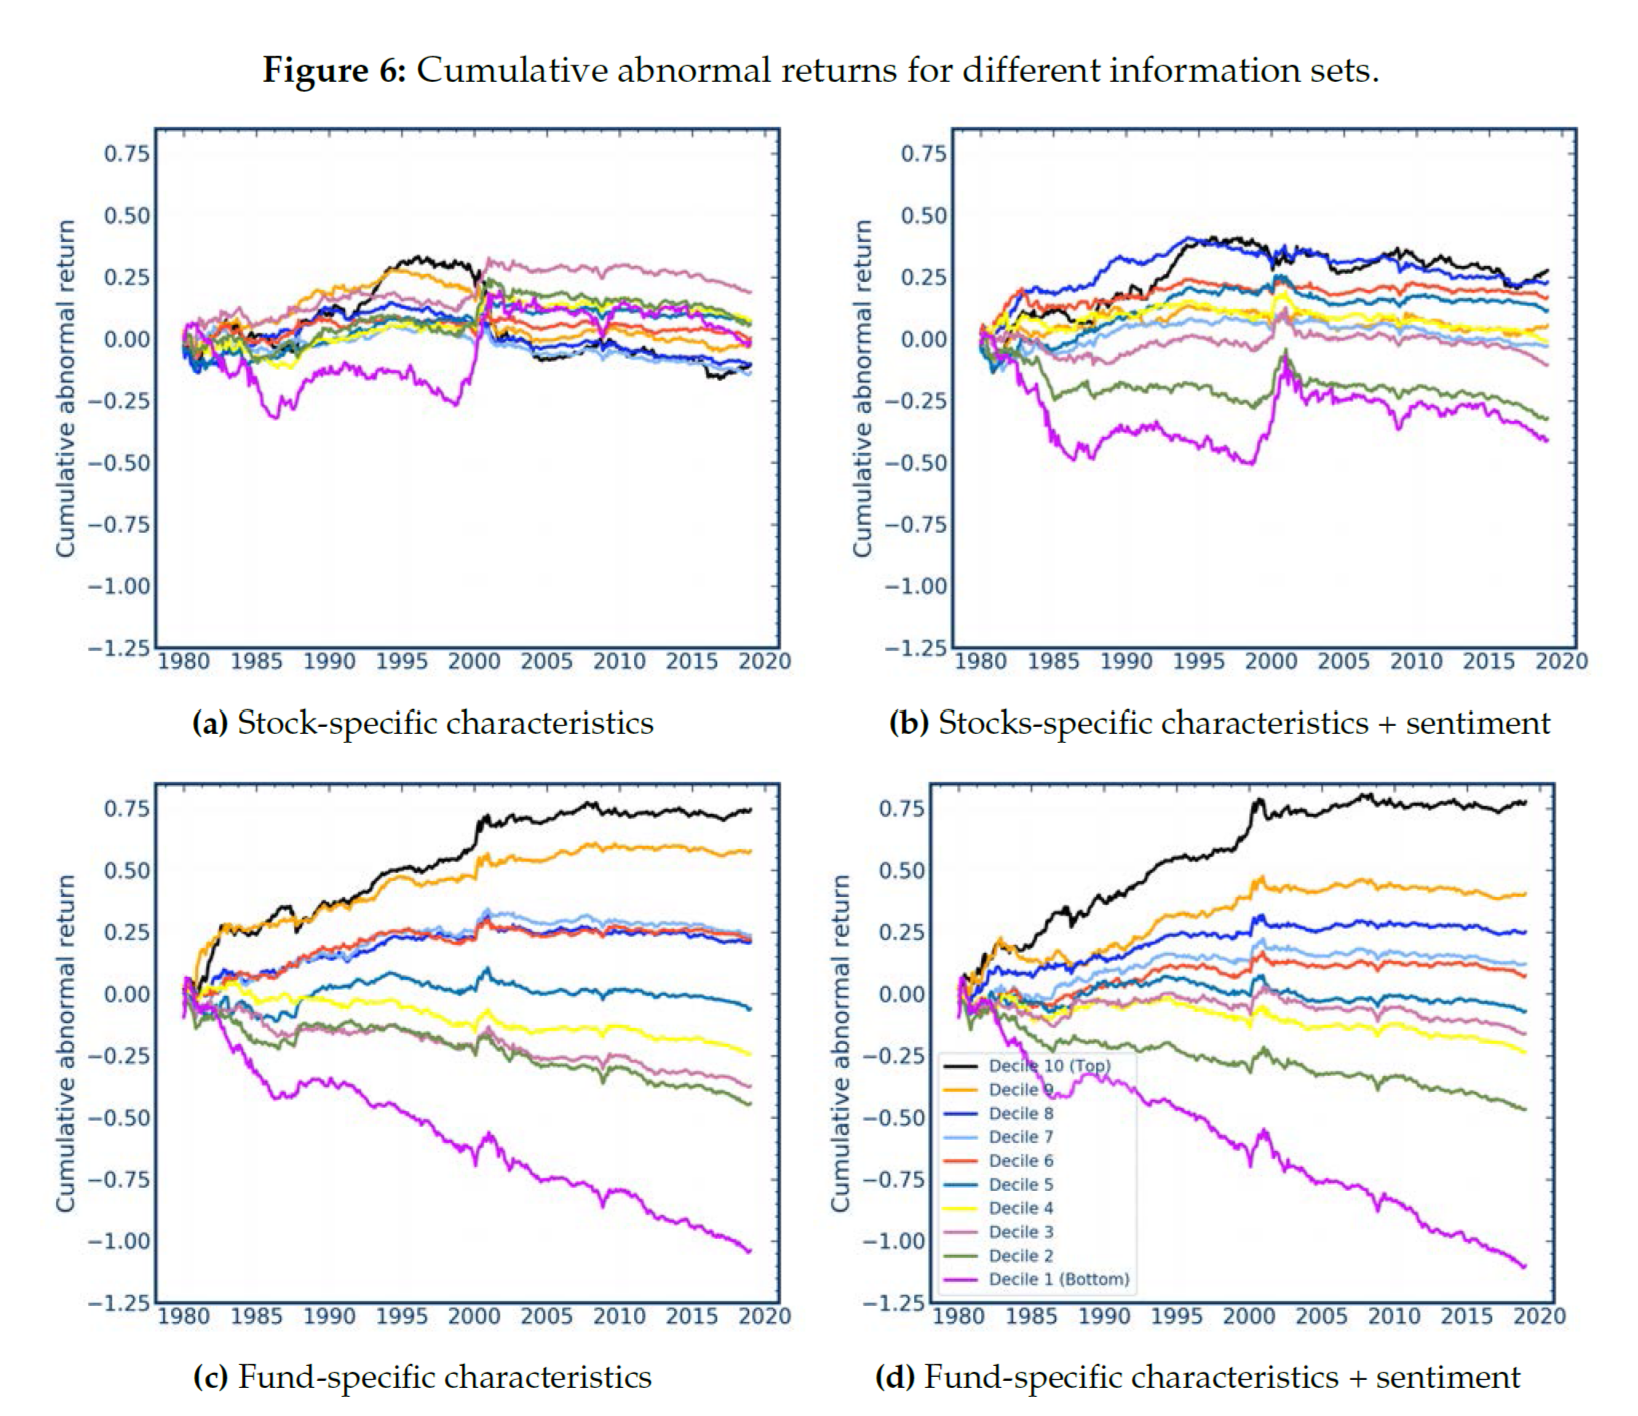
Predicting total fund return: when it comes to predicting total return instead of abnormal return, stock characteristics show substantially predictive ability. The stock characteristics seem to be able to predict the systematic factor component in fund returns.
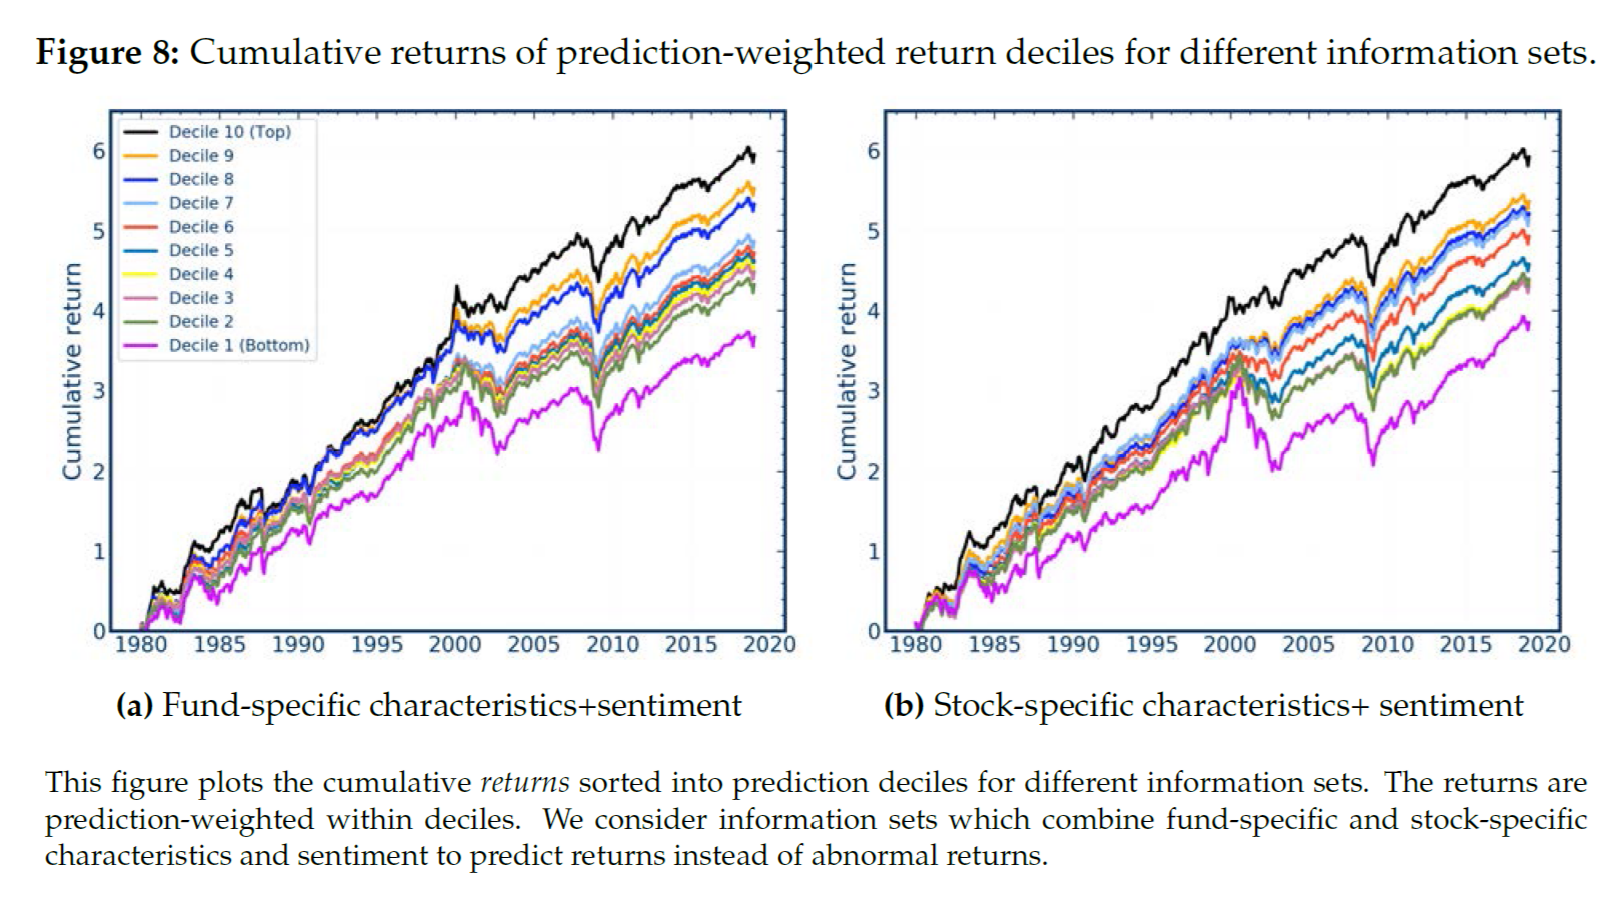
Conclusion: abnormal returns might be a better objective for machine learning prediction in general.
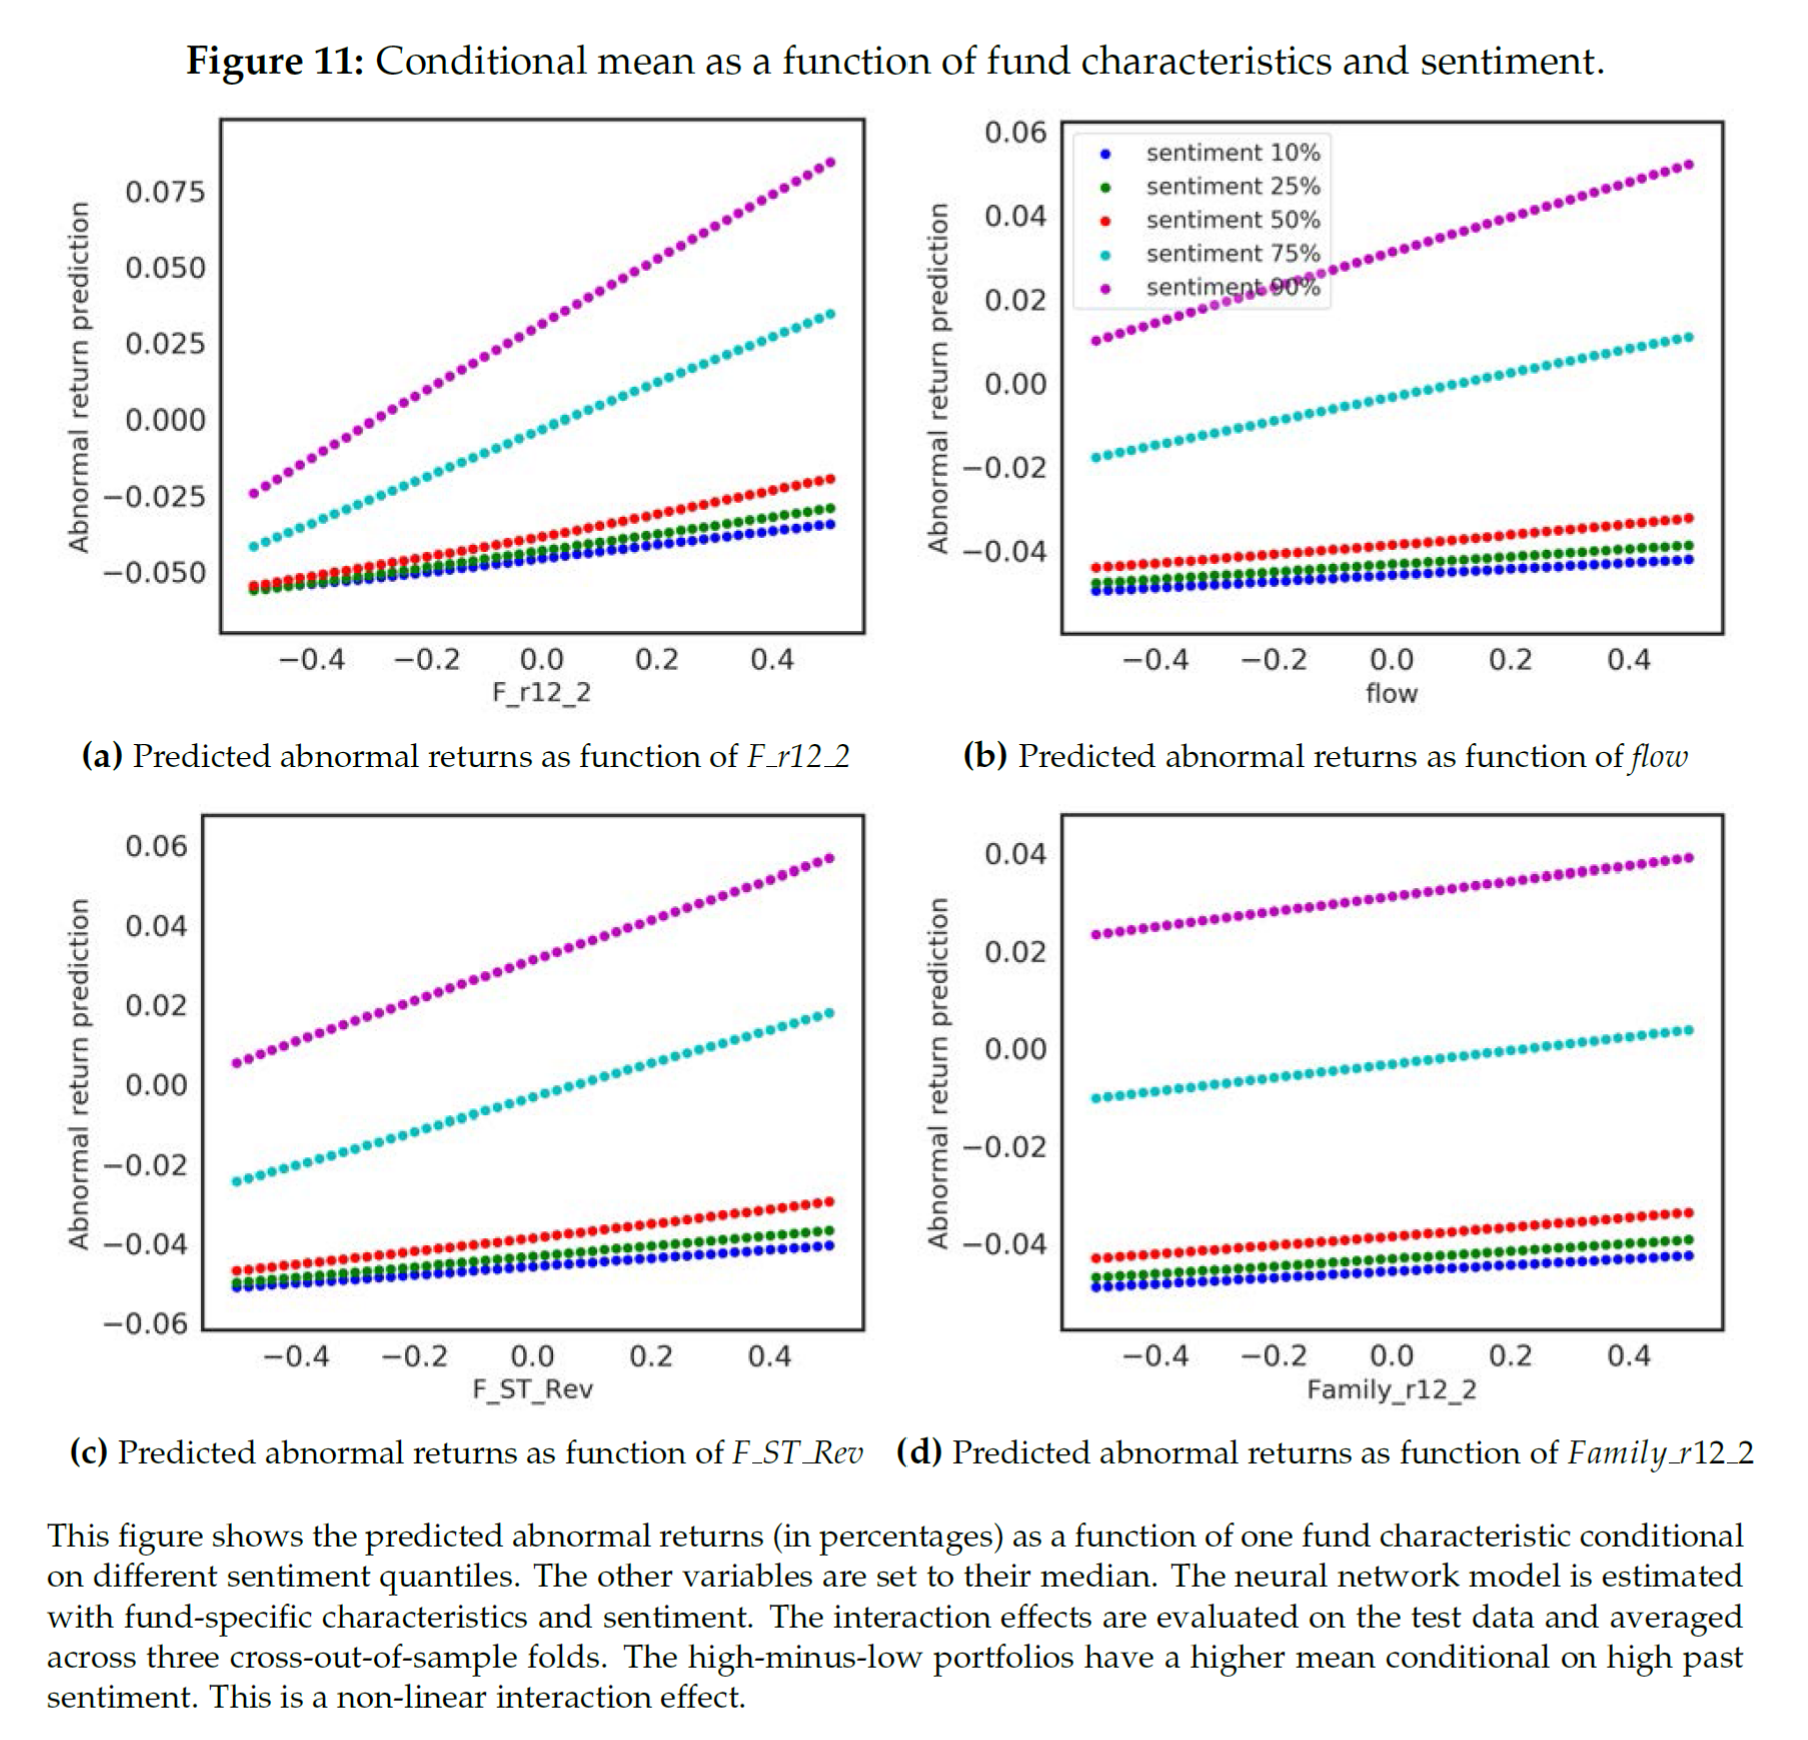
4.4 Variable importance and interaction effects
- construct a metric based on the average absolute gradient of the abnormal return prediction to a characteristic, following
Sadhwani, Giesecke, and Sirignano (2020)andHorel and Giesecke (2020).
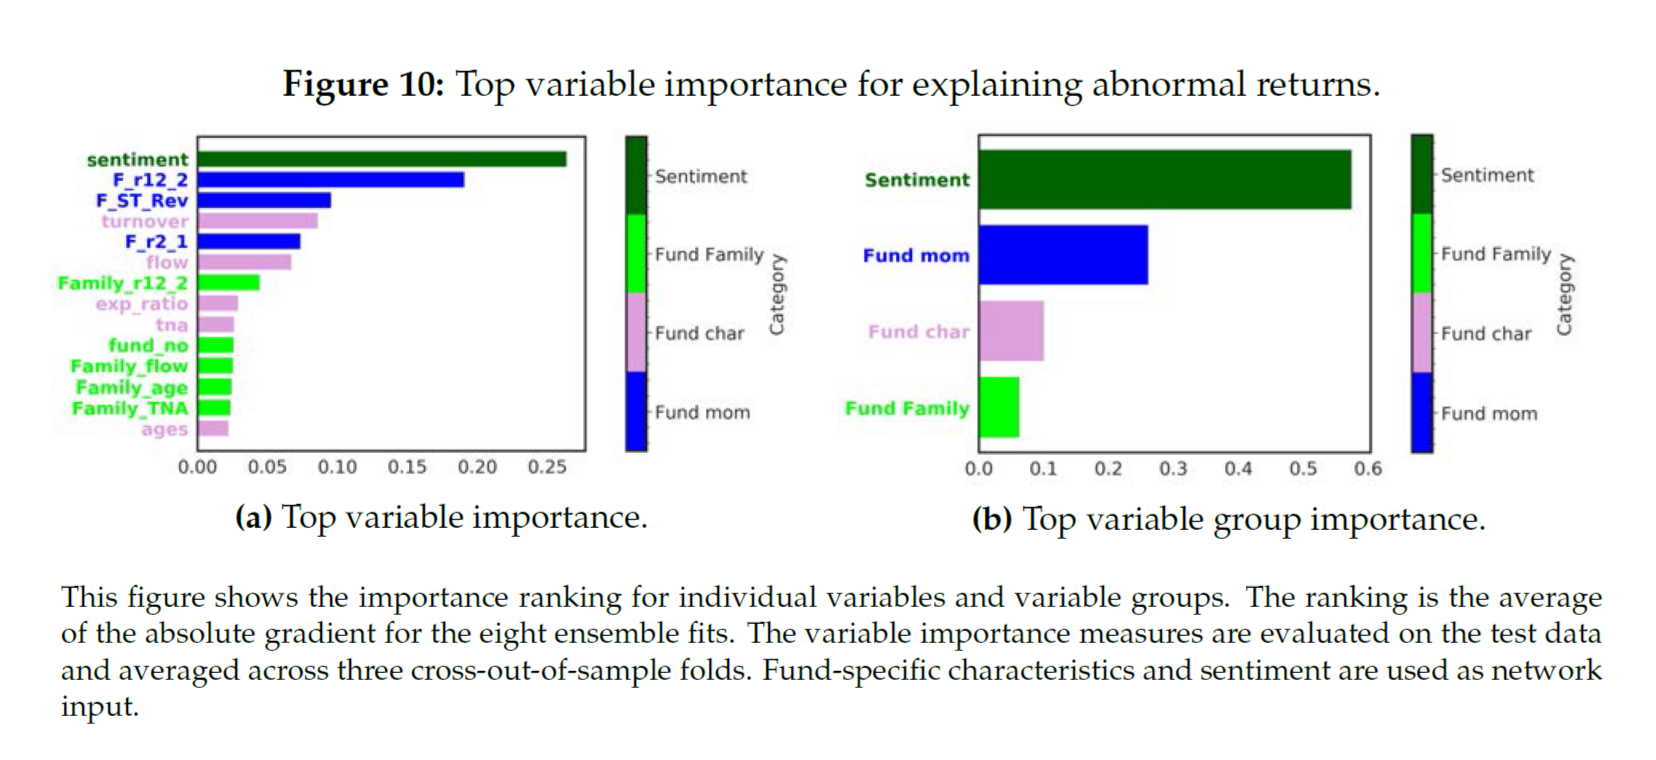
- there is a clearly interaction effect between sentiment and fund characteristics. Predicted abnormal returns are almost linear in fund-specific variables, but the slope of that relationship is substantially higher in times of high sentiment. Note that without interaction effects between sentiment and the flow variable, the different curves in each panel would be parallel shifts. They clearly are not. The interaction effect with sentiment is particularly strong for fund momentum in panel (a). In contrast, there is no interaction effect for family momentum.
5. Inspecting the mechanism
Decompose abnormal return between disclosure dates (between quarters) and within disclosure dates (within quarter):
\[\tag{8} R^{abn}_{i,t} = \underbrace{\tilde R_{i,t} - f_t\tilde \beta_i}_{between \ disclosure \ abnormal \ return} + \underbrace{R_{i,t} - f_t\beta_i - (\tilde R_{i,t} - f_t\tilde\beta_i)}_{within \ disclosure \ abnormal \ return}\] \[\tag{9} = \underbrace{\tilde R_{i,t} - f_t\tilde \beta_i}_{between \ disclosure \ abnormal \ return} + \underbrace{R_{i,t} - \tilde R_{i,t}}_{return \ gap} + \underbrace{f_t(\tilde\beta_i - \beta_i)}_{risk \ exposure \ difference}\]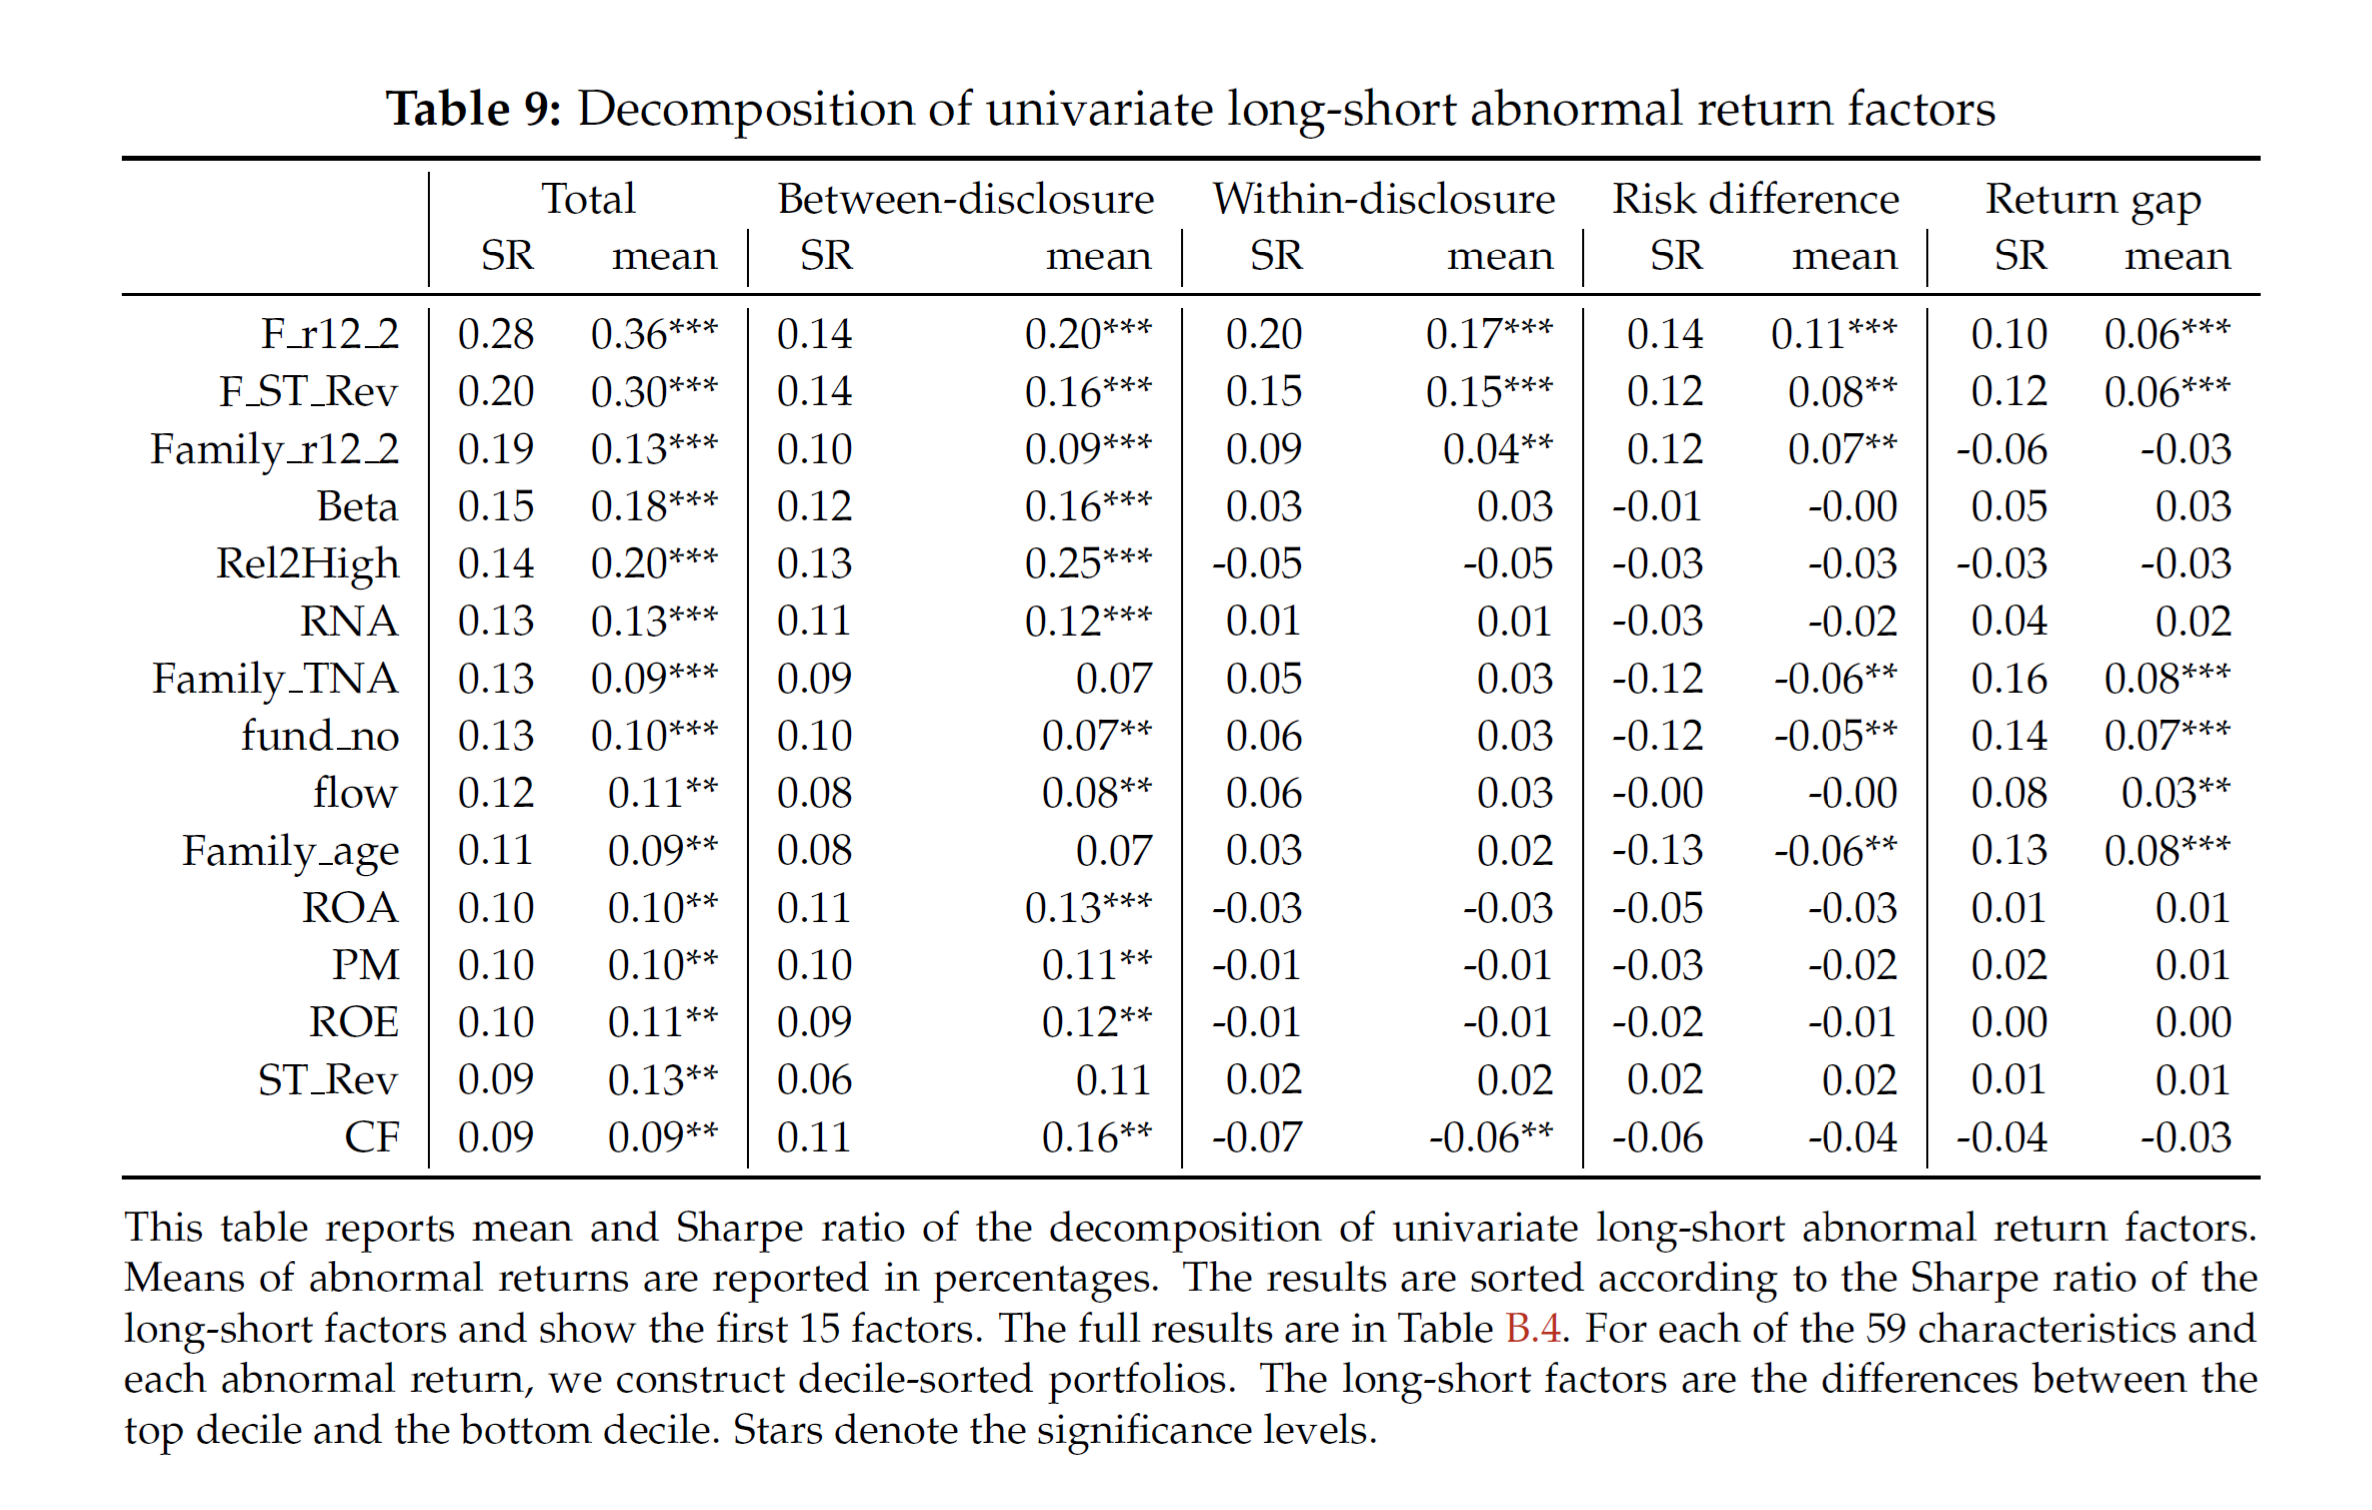
6. Conclusion
This paper revisit the fund performance prediction problem by using neural network to accommodate the non-linearity and interaction effect between different variables. The result shows that a neural network method can reliably estimate a complex functional relationship among a large set of variables. The portfolio constructed based on the predicting result show a significant positive return even after fees. The study of the importance of characteristics show that stock related variables are not as important as fund characteristics, mean while the interaction between sentiment and macro-economic states with those fund characteristics are highly relevant with regards to predicting performance. Also this paper shows that predicting abnormal return is not only statistically better than predicting total return, but also economically meaningful.